Climate and Health: Heat Vulnerability Indices
Assessing Wisconsin heat health risks in a changing climate
Wisconsin's changing climate is getting significantly hotter with more frequent and intense heat waves, according to the Wisconsin Initiative on Climate Change Impacts (WICCI) After reviewing six decades of weather data, WICCI analyzed past and recent heat trends in order to predict future extreme heat conditions and associated health risks.
As our state warms up, it's important to understand heat health risks and ways to protect the health and safety of all Wisconsinites. Extreme heat can cause serious health illnesses, such as heat stress and heat stroke, and even death.
Some people's health and well-being are more impacted by extreme heat than others. Studying different heat health factors help us pinpoint people in our communities who are more likely to experience heat illnesses, including:
- Infants, children and older adults.
- People who work, live, or are active outdoors.
- People without access to air conditioning.
- People with chronic health conditions.
- People who are pregnant.
- Socially isolated people.
Heat vulnerability online map tool
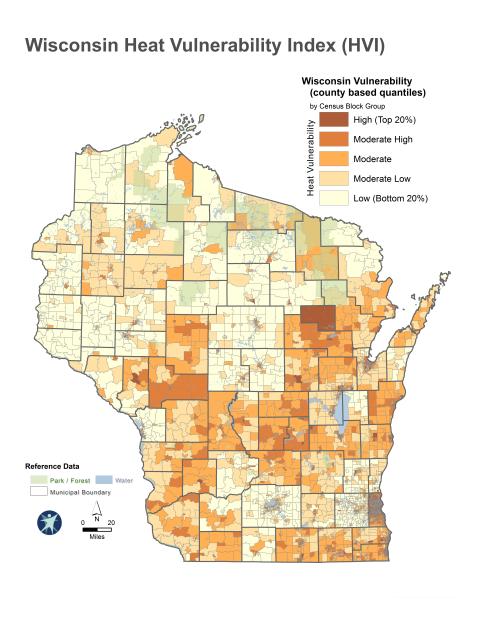
The Heat Vulnerability Indices (HVI) are a series of data map layers designed to identify neighborhoods and people who are at greatest risk of serious health harms from extreme heat in Wisconsin. (See data list below.) The mapped data can inform heat health planning, intervention designs, resource allocation, and outreach when heat waves hit.
The HVI map tool is now available online in an interactive, customizable map format with five map layers that are viewable statewide and by county, Tribal nation, and the greater Milwaukee area. All data can can be downloaded.
How can we improve the HVI map tool?
Please take a minute to share your recommendations on how we can improve the HVI map tool in our short survey. Your feedback will help inform future upgrades to the HVI map tool.
About the Heat Vulnerability Index and data
Wisconsin's heat vulnerability indices use data on existing population and census, natural and built environment, and health factors to identify areas of greatest risk for serious health harms from extreme heat. You can see specific data used in the HVI analyses by clicking on the headers below. For more detailed information on data analyses, refer to the following reports:
- Wisconsin Heat Vulnerability Index, P-00882 (PDF)
- Milwaukee Heat Vulnerability Index, P-00882a (PDF)
- County-specific HVI maps and Tribal nation-specific HVI maps also exist for all counties in Wisconsin.
Indicators included in the Wisconsin Heat Vulnerability Index (HVI)
The Climate and Health Program, with guidance from Technology Services at DHS, used a process developed by the San Francisco Department of Public Health to analyze data that show the people and places that are more likely to experience health harms from extreme heat. There are two heat vulnerability indices, one index covers the entire state of Wisconsin and the other covers the greater Milwaukee area.
The Heat Vulnerability Index includes four categories of data:
- Population density.
- Health factors.
- Natural and built environment.
- Demographic and socioeconomic factors.
The different data categories were separated out and analyzed individually to help identify how each data point affects the likelihood of health harms separately and together. Click on the following labels to see the individual data for each category.
Population per square mile
- Diabetes prevalence*
- Adult asthma prevalence*
- Hypertension rate*
- Percentage of population with obesity (BMI)*
- Percentage uninsured*
- Percentage of population receiving public substance abuse services*
- Percentage of population receiving public mental health services
- Percentage of population that visited an emergency department for heat stress
* Indicators used only in the statewide HVI map.
- Percentage of households in poverty
- Percentage of population aged 0-4
- Percentage of population aged 85+
- Percentage of population living alone
- Percentage of population 65+ living alone
- Percentage of non-white population
- Percentage of population with less than high school education
- July 6, 2012 temperature (hottest day of 2012)
- July 2012, average PM 2.5 concentration (ug/m3)
- July 2012, maximum recorded ozone level (ppb)
- Percentage of households without a vehicle
- Medium- and high-density land cover classification
- Nursing home bed count
For more information, email DHSClimate@dhs.wisconsin.gov or call 608-266-1120.
County and Tribal nation HVI maps
County-specific heat vulnerability index (HVI) maps were created for the entire state of Wisconsin. The data displayed in the maps are meant to serve as an informational tool to better understand the spatial distribution of human populations most vulnerable to extreme heat-related events.
The county-specific maps are based on the statewide Wisconsin HVI, but have a reduced number of health-related indicators. Each county map is representative of that county, and is not comparable to maps for other counties in Wisconsin.
To view your desired HVI map, choose the county or Tribal nation in the Service Area dropdown, then click "Apply."

