WISH: Other Infant Mortality Measures
Below you will find Wisconsin infant mortality rates by race from 1985 through 2023.
| Year | Black | White |
|---|---|---|
| 2023 | 14.3 | 4.4 |
| 2022 | 11.4 | 4.6 |
| 2021 | 12.8 | 4.1 |
| 2020 | 14.3 | 4.4 |
| 2019 | 12.5 | 4.8 |
| 2018 | 12.8 | 4.8 |
| 2017 | 15.7 | 4.3 |
| 2016 | 15.2 | 5.3 |
| 2015 | 14.0 | 4.2 |
| 2014 | 12.5 | 4.9 |
| 2013 | 15.8 | 4.9 |
| 2012 | 13.2 | 4.7 |
| 2011 | 13.9 | 5.3 |
| 2010 | 13.9 | 4.9 |
| 2009 | 14.3 | 4.9 |
| 2008 | 13.8 | 5.9 |
| 2007 | 14.5 | 5.3 |
| 2006 | 17.2 | 4.9 |
| 2005 | 15.0 | 5.6 |
| 2004 | 19.2 | 4.5 |
| 2003 | 15.3 | 5.3 |
| 2002 | 18.3 | 5.5 |
| 2001 | 18.7 | 5.7 |
| 2000 | 16.8 | 5.6 |
| 1999 | 14.9 | 5.7 |
| 1998 | 17.9 | 5.6 |
| 1997 | 13.4 | 5.4 |
| 1996 | 18.3 | 5.9 |
| 1995 | 17.9 | 6.2 |
| 1994 | 18.6 | 6.5 |
| 1993 | 14.9 | 7.0 |
| 1992 | 14.0 | 6.3 |
| 1991 | 14.0 | 7.7 |
| 1990 | 19.7 | 7.2 |
| 1989 | 18.9 | 7.9 |
| 1988 | 17.2 | 7.2 |
| 1987 | 17.3 | 7.7 |
| 1986 | 18.0 | 8.4 |
| 1985 | 17.5 | 8.4 |
Source: Office of Health Informatics, Division of Public Health, Department of Health Services.
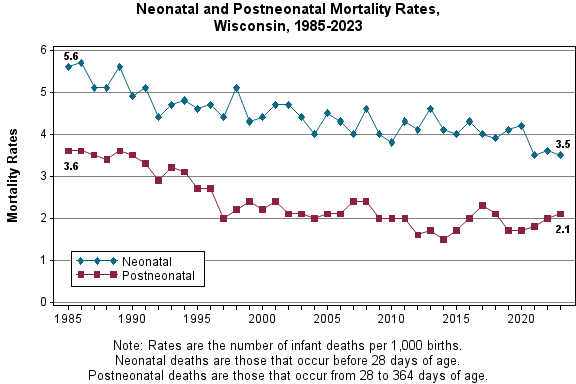
| Year | Neonatal | Postneonatal |
|---|---|---|
| 2023 | 3.5 | 2.1 |
| 2022 | 3.6 | 2.0 |
| 2021 | 3.5 | 1.8 |
| 2020 | 4.2 | 1.7 |
| 2019 | 4.1 | 1.7 |
| 2018 | 3.9 | 2.1 |
| 2017 | 4.0 | 2.3 |
| 2016 | 4.3 | 2.0 |
| 2015 | 4.0 | 1.7 |
| 2014 | 4.1 | 1.5 |
| 2013 | 4.6 | 1.7 |
| 2012 | 4.1 | 1.6 |
| 2011 | 4.3 | 2.0 |
| 2010 | 3.8 | 2.0 |
| 2009 | 4.0 | 2.0 |
| 2008 | 4.6 | 2.4 |
| 2007 | 4.0 | 2.4 |
| 2006 | 4.3 | 2.1 |
| 2005 | 4.5 | 2.1 |
| 2004 | 4.0 | 2.0 |
| 2003 | 4.4 | 2.1 |
| 2002 | 4.7 | 2.1 |
| 2001 | 4.7 | 2.4 |
| 2000 | 4.4 | 2.2 |
| 1999 | 4.3 | 2.4 |
| 1998 | 5.1 | 2.2 |
| 1997 | 4.4 | 2.0 |
| 1996 | 4.7 | 2.7 |
| 1995 | 4.6 | 2.7 |
| 1994 | 4.8 | 3.1 |
| 1993 | 4.7 | 3.2 |
| 1992 | 4.4 | 2.9 |
| 1991 | 5.1 | 3.3 |
| 1990 | 4.9 | 3.5 |
| 1989 | 5.6 | 3.6 |
| 1988 | 5.1 | 3.4 |
| 1987 | 5.1 | 3.5 |
| 1986 | 5.7 | 3.6 |
| 1985 | 5.6 | 3.6 |
Source: Office of Health Informatics, Division of Public Health, Department of Health Services.


