WISH: Other Measures of Fertility
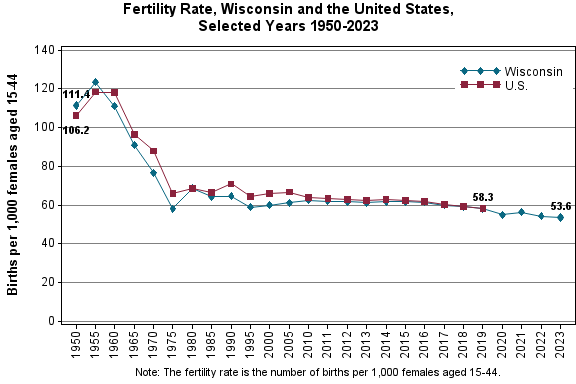
Below you will find data related to measures of fertility, such as fertility rate, age-specific birth rates, and the total fertility rate.
| Year | Wisconsin | U.S. |
|---|---|---|
| 2024 | 52.8 | N/A |
| 2023 | 53.6 | N/A |
| 2022 | 54.2 | N/A |
| 2021 | 56.2 | N/A |
| 2020 | 54.9 | N/A |
| 2019 | 58.0 | 58.3 |
| 2018 | 59.0 | 59.1 |
| 2017 | 59.9 | 60.3 |
| 2016 | 61.5 | 62.0 |
| 2015 | 61.8 | 62.5 |
| 2014 | 61.7 | 62.9 |
| 2013 | 61.2 | 62.5 |
| 2012 | 61.8 | 63.0 |
| 2011 | 62.0 | 63.2 |
| 2010 | 62.4 | 64.1 |
| 2005 | 61.2 | 66.7 |
| 2000 | 59.9 | 65.9 |
| 1995 | 58.9 | 64.6 |
| 1990 | 64.5 | 70.9 |
| 1985 | 64.2 | 66.3 |
| 1980 | 68.8 | 68.4 |
| 1975 | 58.2 | 66.0 |
| 1970 | 76.6 | 87.9 |
| 1965 | 90.8 | 96.3 |
| 1960 | 110.9 | 118.0 |
| 1955 | 123.4 | 118.3 |
| 1950 | 111.4 | 106.2 |
Note: The fertility rate is the number of births per 1,000 females aged 15-44.
Source: Wisconsin data are from resident birth certificates, Office of Health Informatics, Division of Public Health, Wisconsin Department of Health Services.
The U.S. rates for 1950-2015 are from the National Vital Statistics Reports, "Births: Final Data for 2015," Volume 66, Number 1, January 5, 2017. The U.S. rate for 2016 is from the National Vital Statistics Reports, "Births: Final Data for 2016," Volume 67, Number 1, January 31, 2018. The U.S. rate for 2017 is from the National Vital Statistics Reports, "Births: Final Data for 2017," Volume 67, Number 8, November 7, 2018. The U.S. rate for 2018 is from the National Vital Statistics Reports, "Births: Final Data for 2018," Volume 68, Number 13, November 27, 2019. The U.S. rate for 2019 is from the National Vital Statistics Reports, "Births: Final Data for 2019," Volume 70, Number 2, March 23, 2021.
| Year | 15-19 | 20-24 | 25-29 | 30-34 | 35-39 | 40-44 | 45-49 |
|---|---|---|---|---|---|---|---|
| 2024 | 9.7 | 45.2 | 96.1 | 106.7 | 51.2 | 10.1 | 0.6 |
| 2023 | 9.9 | 46.3 | 99.9 | 108.6 | 50.7 | 9.5 | 0.6 |
| 2022 | 9.8 | 44.3 | 100.0 | 114.8 | 50.2 | 9.7 | 0.6 |
| 2021 | 10.3 | 48.3 | 104.4 | 117.2 | 49.5 | 9.8 | 0.6 |
| 2020 | 10.9 | 50.0 | 102.3 | 112.3 | 47.6 | 9.1 | 0.5 |
| 2019 | 12.5 | 54.9 | 105.7 | 114.5 | 48.3 | 9.4 | 0.6 |
| 2018 | 13.0 | 56.3 | 109.3 | 113.7 | 49.3 | 9.4 | 0.5 |
| 2017 | 13.8 | 58.8 | 114.7 | 111.9 | 47.8 | 9.3 | 0.5 |
| 2016 | 15.0 | 59.6 | 121.4 | 113.4 | 48.5 | 8.6 | 0.4 |
| 2015 | 16.2 | 63.9 | 122.4 | 110.1 | 47.7 | 8.5 | 0.5 |
| 2014 | 18.0 | 66.9 | 121.0 | 108.0 | 46.5 | 8.2 | 0.4 |
| 2013 | 19.5 | 69.3 | 118.6 | 105.6 | 45.3 | 7.9 | 0.5 |
| 2012 | 21.8 | 73.0 | 119.0 | 104.1 | 44.6 | 8.2 | 0.5 |
| 2011 | 23.3 | 75.9 | 119.0 | 104.5 | 43.3 | 8.0 | 0.3 |
| 2010 | 26.2 | 79.0 | 117.6 | 104.5 | 42.4 | 7.9 | 0.5 |
| 2005 | 30.1 | 81.5 | 119.4 | 104.1 | 42.4 | 7.0 | 0.3 |
| 2000 | 35.2 | 89.2 | 119.5 | 96.2 | 35.7 | 6.7 | 0.3 |
| 1995 | 37.8 | 88.7 | 115.4 | 85.4 | 30.7 | 5.2 | 0.3 |
| 1990 | 42.4 | 96.2 | 123.7 | 78.7 | 27.9 | 4.4 | 0.3 |
| 1985 | 38.8 | 101.9 | 117.3 | 67.2 | 22.3 | 3.3 | 0.3 |
| 1980 | 39.5 | 112.1 | 127.5 | 67.3 | 19.0 | 4.0 | 0.2 |
| 1975 | 37.8 | 112.9 | 125.1 | 62.1 | 21.8 | 5.2 | 0.3 |
| 1970 | 45.1 | 166.6 | 161.9 | 82.6 | 39.7 | 11.4 | 3.1 |
| 1965 | 41.2 | 229.2 | 204.8 | 125.8 | 62.5 | 19.0 | 1.2 |
| 1960 | 64.4 | 284.0 | 235.3 | 141.0 | 75.6 | 21.7 | 5.5 |
| 1955 | 57.5 | 245.6 | 217.0 | 138.1 | 74.2 | 20.9 | 0.8 |
| 1950 | 48.9 | 208.6 | 192.3 | 121.8 | 61.4 | 17.7 | 5.5 |
Note: An age-specific birth rate is the number of births per 1,000 females in that age group.
Source: Resident birth certificates, Office of Health Informatics, Division of Public Health, Wisconsin Department of Health Services.
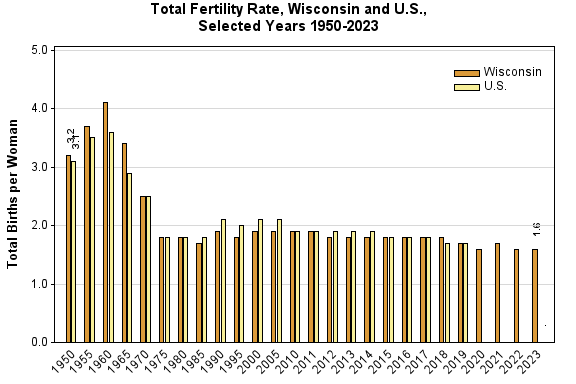
| Year | Wisconsin | U.S. |
|---|---|---|
| 2024 | 1.6 | N/A |
| 2023 | 1.6 | N/A |
| 2022 | 1.6 | N/A |
| 2021 | 1.7 | N/A |
| 2020 | 1.6 | N/A |
| 2019 | 1.7 | 1.7 |
| 2018 | 1.8 | 1.7 |
| 2017 | 1.8 | 1.8 |
| 2016 | 1.8 | 1.8 |
| 2015 | 1.8 | 1.8 |
| 2014 | 1.8 | 1.9 |
| 2013 | 1.8 | 1.9 |
| 2012 | 1.8 | 1.9 |
| 2011 | 1.9 | 1.9 |
| 2010 | 1.9 | 1.9 |
| 2005 | 1.9 | 2.1 |
| 2000 | 1.9 | 2.1 |
| 1995 | 1.8 | 2.0 |
| 1990 | 1.9 | 2.1 |
| 1985 | 1.7 | 1.8 |
| 1980 | 1.8 | 1.8 |
| 1975 | 1.8 | 1.8 |
| 1970 | 2.5 | 2.5 |
| 1965 | 3.4 | 2.9 |
| 1960 | 4.1 | 3.6 |
| 1955 | 3.7 | 3.5 |
| 1950 | 3.2 | 3.1 |
Note: The Total Fertility Rate for a given year estimates the number of children that would be born to each woman in a population during her lifetime if she were to have children throughout her childbearing years (considered ages 15 through 44) at the same rate as women of those ages actually did in that year.
The Total Fertility Rate summarizes the potential impact of current fertility patterns on completed family size. The TFR estimates the number of births that a hypothetical cohort of 1,000 women would have if they experienced throughout their childbearing years the same age-specific birth rates observed in a given year. The rate can be expressed as the average number of children that would be born per woman.
Source: Wisconsin data are from resident birth certificates, Office of Health Informatics, Division of Public Health, Wisconsin Department of Health Services.
The U.S. rates for 1950-1965 are from the National Center for Health Statistics, "Vital Statistics of the United States, 2000, Volume I, Natality." The U.S. rates for 1970-2014 are from National Vital Statistics Reports, "Births: Final Data for 2014," Volume 64, Number 12, December 23, 2015. The U.S. rates for 2015-2016 are from the National Vital Statistics Reports, "Births: Final Data for 2016," Volume 67, Number 1, January 31, 2018. The U.S. rates for 2017 are from the National Vital Statistics Reports, "Births: Final Data for 2017," Volume 67, Number 8, November 7, 2018. The U.S. rates for 2018 are from the National Vital Statistics Reports, "Births: Final Data for 2018," Volume 68, Number 13, November 27, 2019. The U.S. rates for 2019 are from the National Vital Statistics Reports, "Births: Final Data for 2019," Volume 70, Number 2, March 23, 2021.


